Oh Crap. US Census Reports New Homes Got Bigger in 2013

Maybe it’s all the refined carbohydrates. Maybe it’s the need to find storage for that 4K roll pack of toilet paper we got from Costco. Whatever the reason, American homes keep getting bigger–despite the environmental implications of doing so, despite research suggesting we don’t use that extra space. The “U.S. Census Bureau: 2013 Characteristics of New Housing” report came out a few days ago and the stats don’t look good. Here are some of the findings for new, single-family US homes built in 2013:

  • Median house size was at an all time high of 2,478 sq ft–up from 2,390 the year before.
  • Average house size was also bigger than ever at a whopping 2,662 sq ft–up from the previous all time high last year at 2,585.
  • The southern region (Delaware to Texas) grew the most in the last ten years, boasting 15.3% growth for median housing size, versus 11.6% nationally for that same period.

Before we totally lose our you-know-what, some things should be noted:

  • The 569K houses completed in 2013, while higher than the 483K the year before, is far less than the 1.6M in 2006, the peak of the housing bubble.
  • More restrictive lending policies mean that most people buying homes in today’s market are wealthier repeat buyers, most of whom are looking for larger homes; this consideration might ostensibly skew the numbers to seem like there is a disproportionate demand for big homes.
  • Lot size barely grew. The median lot size was 8,596 sq ft versus 8,577 the year before. Average lot size was 15,456 sq ft, down from 15,634 the year before.
  • There were 195K new multifamily units completed in 2013. Up from 166 in 2012.
  • Median and average square footage on multifamily units (1,059 and 1,107 sq ft) were down in size from 2012 (1,098 and 1,138 sq ft).
  • There were 1K more multifamily buildings completed in 2013 than 2012.

Okay, now that we got that devil’s advocacy out of the way, we can ask, “what the hell?”

The fact is people–at least if this info is any indication–are not particularly good at saying yes to less, at least when they can afford more. An alloy of cheap labor, land and energy, particularly in the south, have made it easy for construction companies to offer relatively cheap and large houses. And with mortgage rates still hovering around 4%, there are still quite a few people able to buy these places.

Neal Heery, founding partner of Atlanta Fine Homes Sotheby’s International Realty, told the Wall Street Journal that his clients still buy as much space as they can afford. He told WSJ this about their housing desires and the commensurate square footage increase:

Does the buyer want a third garage bay? They sure do. Do they want a master (bedroom) on the main (floor)? Sure, they do. By the time we get a third garage bay and a master on the main, it’s hard to build a house of less than 4,500 square feet.

Whether these desires would be as strong if builders were making smartly-designed, smaller, more affordable options is another matter. In other word, is supply dictating demand? Needless to say, these homes exacerbate sprawl, are more energy intensive and in all likelihood allow people to buy and store more stuff they don’t need. We can’t help but say we’re a bit bummed this monstrous home trend continues.

So what does all of this mean for the “small space movement” we at LifeEdited hope to herald?

Hopefully, it means nothing. There is still a growing trend toward centralized, urban living, particularly in younger generations–living that is pretty incompatible with McMansions. And when these younger generations get older, they might not opt for, nor want to or be able to maintain their folks six-bedroom McMansion. Furthermore, multifamily construction does continue to grow, albeit at a slower pace than we’d like. And think about it, housing patterns can change overnight. There were contractors building Chateaus right before the French Revolution. Then business fell off precipitously. Things change.

As author William Gibson put it, “The future is already here–it’s just not very evenly distributed.” In other words, before most things become mainstream they are unusual and seemingly anomalous–until they’re not. We like to believe that despite the re-embiggening of the American house, a downsized existence is still very much in our future. Whether people will choose that future like we hope they do, or whether it will be imposed on them by financial and environmental circumstances, remains to be seen.

Modern custom built luxury home image via Shutterstock

Why Household Size Matters

We often talk about housing density. We’re mostly in favor of it. In general, density allows more people to live in less area, resulting in small, efficient homes, walkable/bikable/public-transportation friendly living, more social living (by virtue of being closer to people) and smaller carbon footprint. We also talk about sprawl–density’s counterpart. Sprawl typically entails bigger homes, using up more space, pushing people further afield in socially isolated settings, necessitating more roads, more cars, more carbon, more everything basically.

We tend to frame the density issue in terms of housing size, because it’s easy to understand that big homes, as a rule, reduce overall density. But there is something else, just as important as housing size, that must be factored in to understand how density works, and that is household size.

Household size, as one might imagine, refers to the number of people that inhabit a given dwelling unit. If a six person family lives in one house, that’s a six person household. Without household size, it’s almost impossible to understand density. For example, if that six-person household occupies a 1,000 sq ft house, that’s 166 sq ft/person–a number that could rival any micro-apartment (assuming other factors like lot size, foot area ratio, etc are the same).

It’s important to understand household size, because across the globe, the numbers are shrinking, resulting in more houses and less density.

Let’s look at the United States to illustrate. In 1950, the average household contained 3.37 people. Today, that number is 2.6. In 1950, the average new house was 983 sq ft, or 291 sq ft/person based on the household size. The average new house in 2012 was just over 2500 sq ft, or 961 sq ft/person.

It’s not just the Americans for once. All across the globe–in both developed and developing nations–household numbers are shrinking. For example, the European average is down to about 2.5 people/household–half as many as 100 years ago.

household-size

According to a new paper in the journal Population and Environment there are a number of culprits:

Household proliferation is also due to aging, increasing divorce rates, and decreasing incidence of multigenerational households, which may be partly attributable to changing preferences for privacy. Indeed, the number of households may grow globally despite population numbers stabilizing. According to convergence theory, household size decreases (often from >5 to <3) as a society undergoes urbanization and industrialization. This trend largely occurred in developed nations during the latter part of the 1800s. If convergence theory applies to today’s developing nations, billions of households could be formed despite declines in population growth.

Mason Bradbury, one of the aforementioned papers’ authors, gives an idea of what this decreased household number could mean in terms of numbers:

From a more simplistic perspective, declining household sizes, from over 5 to approximately 2.5, will mean approximately twice as many houses will be needed per capita in any areas of the world yet to undergo the shift in household size. If the average household size had been 2.5 people globally in 2010 [developing nations still boast larger household sizes], then the number of households would have been 41% higher, resulting in 800 million additional households…

And according to Atlantic Cities, more homes have more demands:

That’s also 800 million more refrigerators and ovens and climate-control systems, 800 million more homes that need roads and sewage hookups and access to a power grid. If every one of those homes were the size of the average American home circa 2002, the researchers calculate that would mean constructing about 72,000 square miles of new housing on the planet.

As a small space design blog, we’d be remiss if we didn’t mention that the amount of sprawl (i.e. the 72K sq miles) they calculate is based on a house size of 2509 sq ft–McMansions for all.

Which leads to the question of possible ways forward. We see three:

  1. Let things remain the same. Encroach on undeveloped lands and deplete all natural resources until the planet’s homeostatic environmental mechanisms are irrevocably destroyed.
  2. Reverse demographic shifts away from industrialization, the desire for privacy, divorce and so forth.
  3. Rethink housing. Adjust housing style to meet demographic shifts. Have smaller, more efficient houses with shared amenities. Creatively subdivide existing housing. Mitigate sprawl by keeping density high, even outside of major metropolises, permitting walk/bike/public transportation-friendly living.

Options #1 and 2 seem like a stretch, so it could be time to start making houses that meet the needs of today’s smaller households.

Happy Family image via Shutterstock

Via Atlantic Cities

Land Down Under is Over in Terms of Housing Size

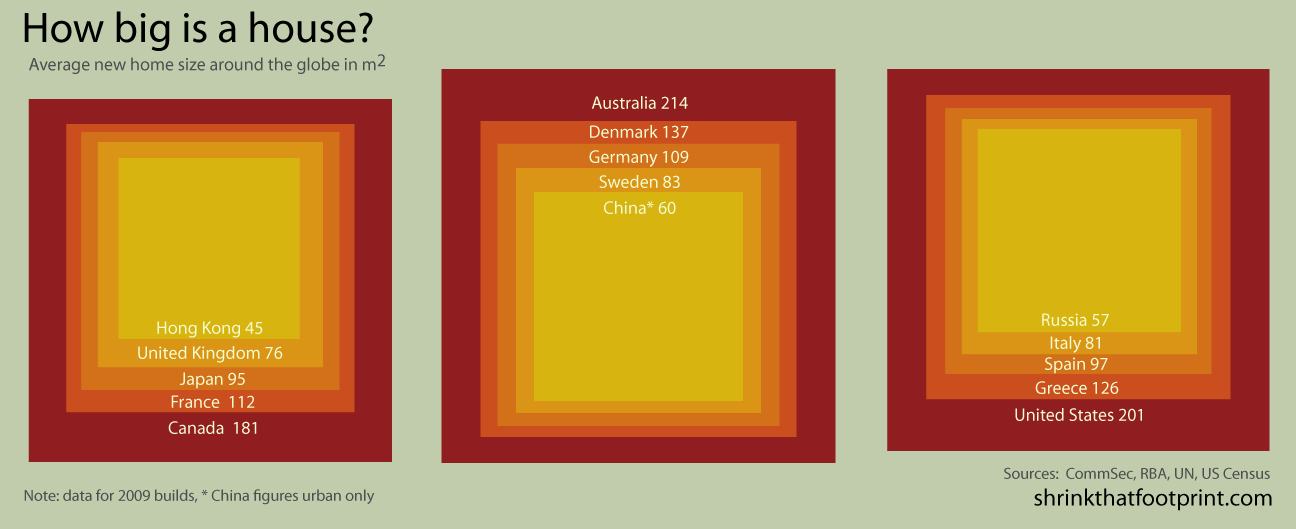
These infographics from Shrink That Footprint show the average new house sizes across the world in 2009. Despite the American penchant to do everything a little bit bigger, it’s the Australians who claim the prize for world’s largest homes.

Without getting too pseudo-scholarly about the situation, the three countries with the biggest homes (Australia, US and Canada) began as British colonies a few hundred years ago. Unlike their motherland, all were fairly unbound geographically (no pesky oceans every 20 miles). A good portion their infrastructures were created after the widespread availability of cars. All of these factors surely contributed to the overgrown housing statistics we see here.

per-capita-square-footage-around-the-world

The other infographic concerns per capita space use, which divides housing size by household number (most developed nations average around 2.5 people per household). These figures are predictably correlated with overall housing size. Again, Australia wins the dubious prize for most space per person.

per-capita-electricity-use

We fished around Shrink That Footprint and found another infographic showing per capita residential electricity use. Interestingly, Australia is a lowly fourth place in this heat (behind France, whose homes are 90% smaller!). Canada makes a from-the-behind dash to the front; with its harsher-than-most winters and big homes, it is often crowned the world’s energy gulping king (there is no explanation as to why Australia’s numbers wouldn’t be commensurately higher due to inordinate use of AC, particularly for its large homes).

What’s not shown in the graphics are trends. For example, China, whose energy consumption is a fraction of countries like the US and Canada, has seen a 600% increase in electricity over the last 20 years. New homes in the US are almost as big as ever. And household sizes are shrinking in Europe (albeit by a small amount), which means per capita housing size is increasing there.

The good news is…we’re not sure what the good news is. Housing sizes are bigger than ever and energy consumption continues to increase across the globe (except for the countries in most dire need). One thing to extract is that housing size is not correlated with quality of life; for example, Denmark and Sweden, who both enjoy high standards of living have smaller homes than the Big Three. But then again, their infrastructures–smaller cities with high quality public transport–support those smaller homes (not the case with the Big Three).

What do you think? What can you deduce from these figures? Is there a silver lining or will the world continue to consume until it bursts? Let us know your thoughts in our comments section.